Calima Map
Visualize Saharan dust movement in real-time
Canary Islands
Updated just now

Showing monitoring stations. Tap a marker for details.
Iberian Peninsula
Updated just now
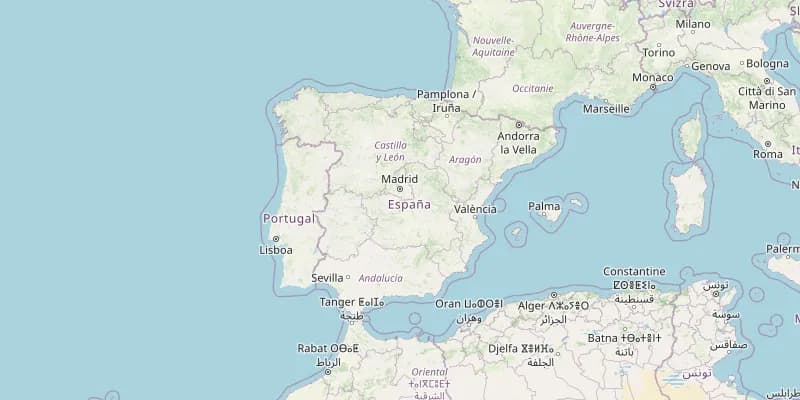
Showing monitoring stations. Tap a marker for details.
Dust Forecast - Canary Islands

Dust Forecast - Mainland Spain

About this map
This map shows dust load forecast from the SKIRON model by the University of Athens. Darker colors indicate higher Saharan dust concentration in the atmosphere.
Updates: every 6 hours